정책동향
The 2010 R&D Scoreboard : UK
- 등록일2011-03-21
- 조회수7264
- 분류정책동향 > 기타 > 기타
-
자료발간일
2011-03-21
-
출처
http://www.bis.gov.uk
- 원문링크
-
키워드
#R&D Scoreboard
- 첨부파일
The 2010 R&D Scoreboard : UK
Key facts
The 1,000 UK companies that invested the most in R&D spent £25.3bn in 2009, down 0.6% year on year.
80% of R&D carried out by the 1,000 top-performing companies is conducted by the 100 most active companies.
Globally, the 1,000 companies most active in R&D spent a combined £344bn, a decrease of 1.9% year on year. The 50 UK companies in this group also decreased their R&D investment, albeit by only 1% overall.
78% of global R&D occurs in five countries: the US; Japan; Germany; France; and the UK.
Global R&D intensity (R&D expenditure as a proportion of sales) stood at 3.6%. Among the UK’s 1,000 leading companies R&D intensity stood at only 1.7%.
The UK’s top R&D companies
In 2009 the UK1000 decreased their investment by 0.6% compared with the previous year, to £25.3bn. This overall decline, which could be attributed to the global economic downturn, was largely owing to decreased spending by firms in the fixed-line telecommunications, banking and aerospace and defence sectors.
However, upon closer inspection a more nuanced picture emerges, as R&D spending developed differently across the whole of the economy. Several of the top sectors by overall investment, including automobiles and parts, software and computer services, and technology hardware and equipment, increased their overall R&D spend, although some at a slower rate than in previous years.
The UK’s 50 biggest investors–which also form part of the G1000 (the largest R&D spenders worldwide)–conducted 60% of the UK1000’s R&D. They decreased their R&D by 1% year on year, while their global peers averaged a 2% year-on-year decrease.
The global picture
Global R&D spending by the G1000 fell by 1.9% to £344bn. Companies registered in just six countries (the US, Japan, Germany, France, Switzerland and the UK), dominate this global spending. Together, they contributed 82% of R&D by the G1000.
In comparison, companies registered in China (including Hong Kong) and India contributed a joint 1.8% to the overall R&D investment by the G1000. However, unlike their global peers, these companies grew their R&D significantly in 2009. Chinese firms grew on average by 40% and Indian firms by 18%. Chinese R&D spending as part of the G1000 is concentrated in technology hardware and equipment, construction and materials and among oil and gas producers. Software and computer services and automobiles and parts companies together account for 73% of the overall R&D spend by Indian companies in the G1000.
Among European representatives in the G1000, UK companies have the fourth-highest R&D spend in absolute terms, behind Switzerland, France and the leader, Germany.
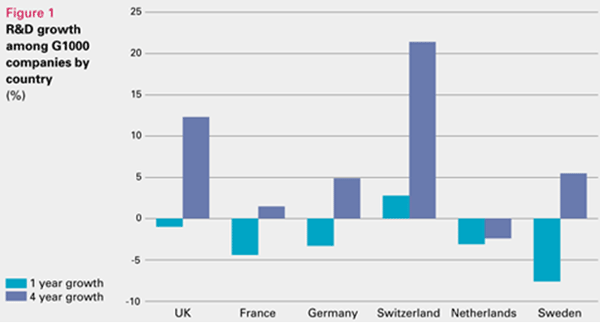
Figure 1 shows average R&D growth among companies in the six biggest EU countries by investment. Looking at growth in R&D investment over a four-year period, only Swiss companies increased their R&D at a faster rate than those from the UK. In 2009 UK companies in the G1000 avoided the bigger cuts to R&D undertaken by their German, French, Dutch and Swedish peers. Only companies registered in Switzerland managed to grow their R&D spending last year.

As in previous Scoreboards, pharmaceuticals and biotechnology remained the largest global R&D sector, growing by 5.5% in 2009. Among the ten largest sectors globally, only three– pharmaceuticals and biotechnology, electronic and electrical equipment, and chemicals–managed to grow their R&D investment. The automobiles and parts sector decreased its R&D spending by the largest percentage (11.6%), followed by technology hardware and equipment (6.3%).
Comparing the UK1000 companies with the G1000 according to their spending reveals divergent developments. R&D spending in the automobiles and parts, technology hardware and equipment, and software and computer services sectors declined globally, while it grew in the UK. The fixed-line telecommunications, oil and gas producing, and banking sectors all grew globally, while declining in the UK.


 2010_RD_Scoreboard_analysis.pdf